Mapy VFR
We offer VFR charts in both electronic and paper formats.
The version designed for iPad is called Mobile FliteDeck VFR.
Mobile FD-VFR subscriptions purchased from our will receive 15 months of revision
Coverage Trip Kit Price
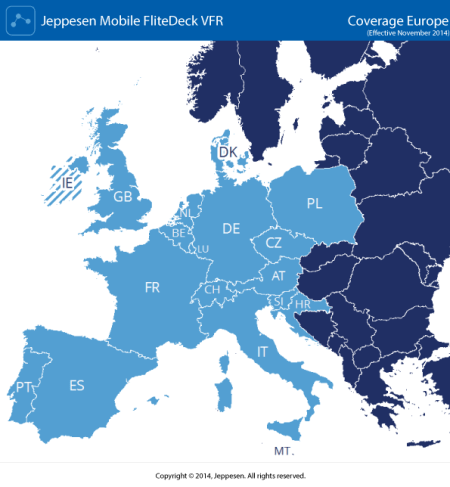
All available countries (Europe)116.81
EuroGermany/Austria/Switzerland 100.00
EuroAustria57.98 Euro
Belgium/Netherlands/Luxemburg57.98 Euro
Croatia / Slovenia49.58 Euro
Czech Republic57.98 Euro
Denmark57.98 Euro
France74.79 Euro
Germany74.79 Euro
Italy57.98 Euro
Poland57.98 Euro
Portugal57.98 Euro
Spain57.98 Euro
Switzerland57.98 Euro
United Kingdom57.98 Euro
USA37.82 Euro
The version designed for iPad is called Mobile FliteDeck VFR.
Mobile FD-VFR subscriptions purchased from our will receive 15 months of revision
Coverage Trip Kit Price
All available countries (Europe)116.81
EuroGermany/Austria/Switzerland 100.00
EuroAustria57.98 Euro
Belgium/Netherlands/Luxemburg57.98 Euro
Croatia / Slovenia49.58 Euro
Czech Republic57.98 Euro
Denmark57.98 Euro
France74.79 Euro
Germany74.79 Euro
Italy57.98 Euro
Poland57.98 Euro
Portugal57.98 Euro
Spain57.98 Euro
Switzerland57.98 Euro
United Kingdom57.98 Euro
USA37.82 Euro
Tips and Tricks
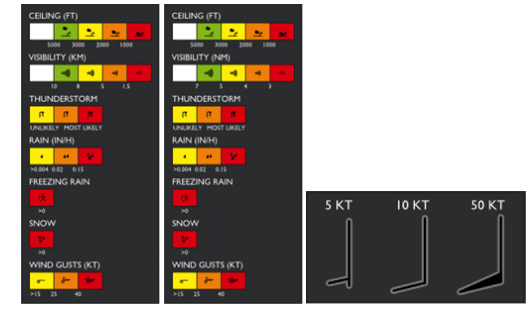
Mobile FliteDeck VFR Version 2.0 intends to simplify your pre-flight weather familiarization and decision making. It delivers indications for safe VFR operations via a matrix-driven color overlay.
For example, a red color overlay warns of severely adverse weather phenomena in a particular region – which could relate to icing, snow, low visibility or else. In doing so, Version 2.0 weather still adheres to the very same interaction methodology as its renowned ‘seamless zooming navigation’, providing further detail the deeper you zoom in. Right upon upgrade to Version 2.0, the new weather concept will automatically synchronize once a WiFi internet connection is established. The synchronization process can be managed in the ‘Downloads’ section, while the cellular reception remains part of the global settings of the iPad.
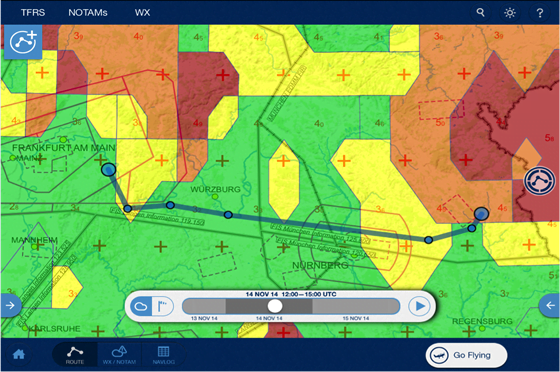
For actual use within the ‘Planning’ and/ or ‘Go Flying’ modes, Version 2.0 weather is considered an overlay. It can be switched ‘On’ or ‘Off’ in the pre-established ‘Overlay’ bar.
Unlike METARs, Version 2.0 wind and phenomena overlays rely on 3-hour high fidelity forecast intervals. Forecasts are calculated every 12 hours for a 10 NM by 10 NM raster, allowing for an exact breakdown of phenomena by tapping on a particular region (raster). Winds are available for ‘Surface’, ‘5000ft’, ‘10000ft’, and ‘15000ft’, with arithmetic wind averages and wind corrections calculated automatically upon zooming. As you may expect, these winds aloft are automatically populated into the NavLog supporting your route.
For example, a red color overlay warns of severely adverse weather phenomena in a particular region – which could relate to icing, snow, low visibility or else. In doing so, Version 2.0 weather still adheres to the very same interaction methodology as its renowned ‘seamless zooming navigation’, providing further detail the deeper you zoom in. Right upon upgrade to Version 2.0, the new weather concept will automatically synchronize once a WiFi internet connection is established. The synchronization process can be managed in the ‘Downloads’ section, while the cellular reception remains part of the global settings of the iPad.
For actual use within the ‘Planning’ and/ or ‘Go Flying’ modes, Version 2.0 weather is considered an overlay. It can be switched ‘On’ or ‘Off’ in the pre-established ‘Overlay’ bar.
Unlike METARs, Version 2.0 wind and phenomena overlays rely on 3-hour high fidelity forecast intervals. Forecasts are calculated every 12 hours for a 10 NM by 10 NM raster, allowing for an exact breakdown of phenomena by tapping on a particular region (raster). Winds are available for ‘Surface’, ‘5000ft’, ‘10000ft’, and ‘15000ft’, with arithmetic wind averages and wind corrections calculated automatically upon zooming. As you may expect, these winds aloft are automatically populated into the NavLog supporting your route.
Weather Controller
The R.2.0 ‘Weather Controller’ (bar) combines weather phenomena, wind, altitudes (for winds) and time-of-day management into a single control unit; thus maintaining a simple, easy to use interface.
On the left side you can toggle between weather phenomena (color-coded overlays) and winds. The bubble represents the central artifact for sliding through multiple forecast intervals and days. It can be dragged over the level bar manually, or played as a video using the ‘Play’ button to the right.
Altitude selections for winds are available by selecting the windsock, then tapping on the displayed altitude indication.
‘Seamless Zooming’ Weather and Details Other than maneuvering through time and altitude using the weather controller, you can also interact through pinch zooming on the chart. Similar to the navigation methodology, zooming in will provide further detail – for instance will the colored tiles be supplemented through symbology. The symbols visible in lower zoom states focus on the most adverse phenomena – which correlate to the respective color coding. For a list of all downloaded phenomena for a particular region, simply tap on the screen: the known textbox will open, then outlining weather details next to airspace information.

The weather phenomena legend is accessible via the “overlay’ bar:
The R.2.0 ‘Weather Controller’ (bar) combines weather phenomena, wind, altitudes (for winds) and time-of-day management into a single control unit; thus maintaining a simple, easy to use interface.
On the left side you can toggle between weather phenomena (color-coded overlays) and winds. The bubble represents the central artifact for sliding through multiple forecast intervals and days. It can be dragged over the level bar manually, or played as a video using the ‘Play’ button to the right.
Altitude selections for winds are available by selecting the windsock, then tapping on the displayed altitude indication.
‘Seamless Zooming’ Weather and Details Other than maneuvering through time and altitude using the weather controller, you can also interact through pinch zooming on the chart. Similar to the navigation methodology, zooming in will provide further detail – for instance will the colored tiles be supplemented through symbology. The symbols visible in lower zoom states focus on the most adverse phenomena – which correlate to the respective color coding. For a list of all downloaded phenomena for a particular region, simply tap on the screen: the known textbox will open, then outlining weather details next to airspace information.
Additional Enhancements in Version 2.0:
Refined NavLog to automatically ingest winds aloft into calculations and display
Introduced bearing & distance indications for all waypoints and airports on the map in live mode
Added IFR waypoints and improved waypoint search capabilities (EU)
Improved TFR display to feature airspace labels, vertical limits, and effective times (USA)
Improved ‘Downloads’ screen and operation (i.e. top down sequence, extraction progress bar)
General Manual (EU) re-integrated into the ‘Country Downloads’
Optimized iOS 8 and XML processing
Fixed update and alerting function
Implemented approximately 200 minor software and design improvements